.png)
To end the week and begin the weekend we have a trough and cold front affecting eastern Australia.
The trough won't be a repeat of the recent, big weather system as it is missing a key ingredient: instability. The big system was a trough and 'cut-off' low that crossed NSW, connecting moisture and instability in a big way. This is missing the low pressure, but southeast QLD and northeast NSW (both west of the ranges) will do the best from this one. However, the rain stretches from Queensland to northern Victoria, and will have embedded storms - and directly under those are locally heavy falls. All of this clears over the weekend.
The southeast feels the brunt of the cold front later on Friday. On the satellite it is the band of cloud over the Bight, with the speckled cloud in behind it indicating the cold air that it brings.
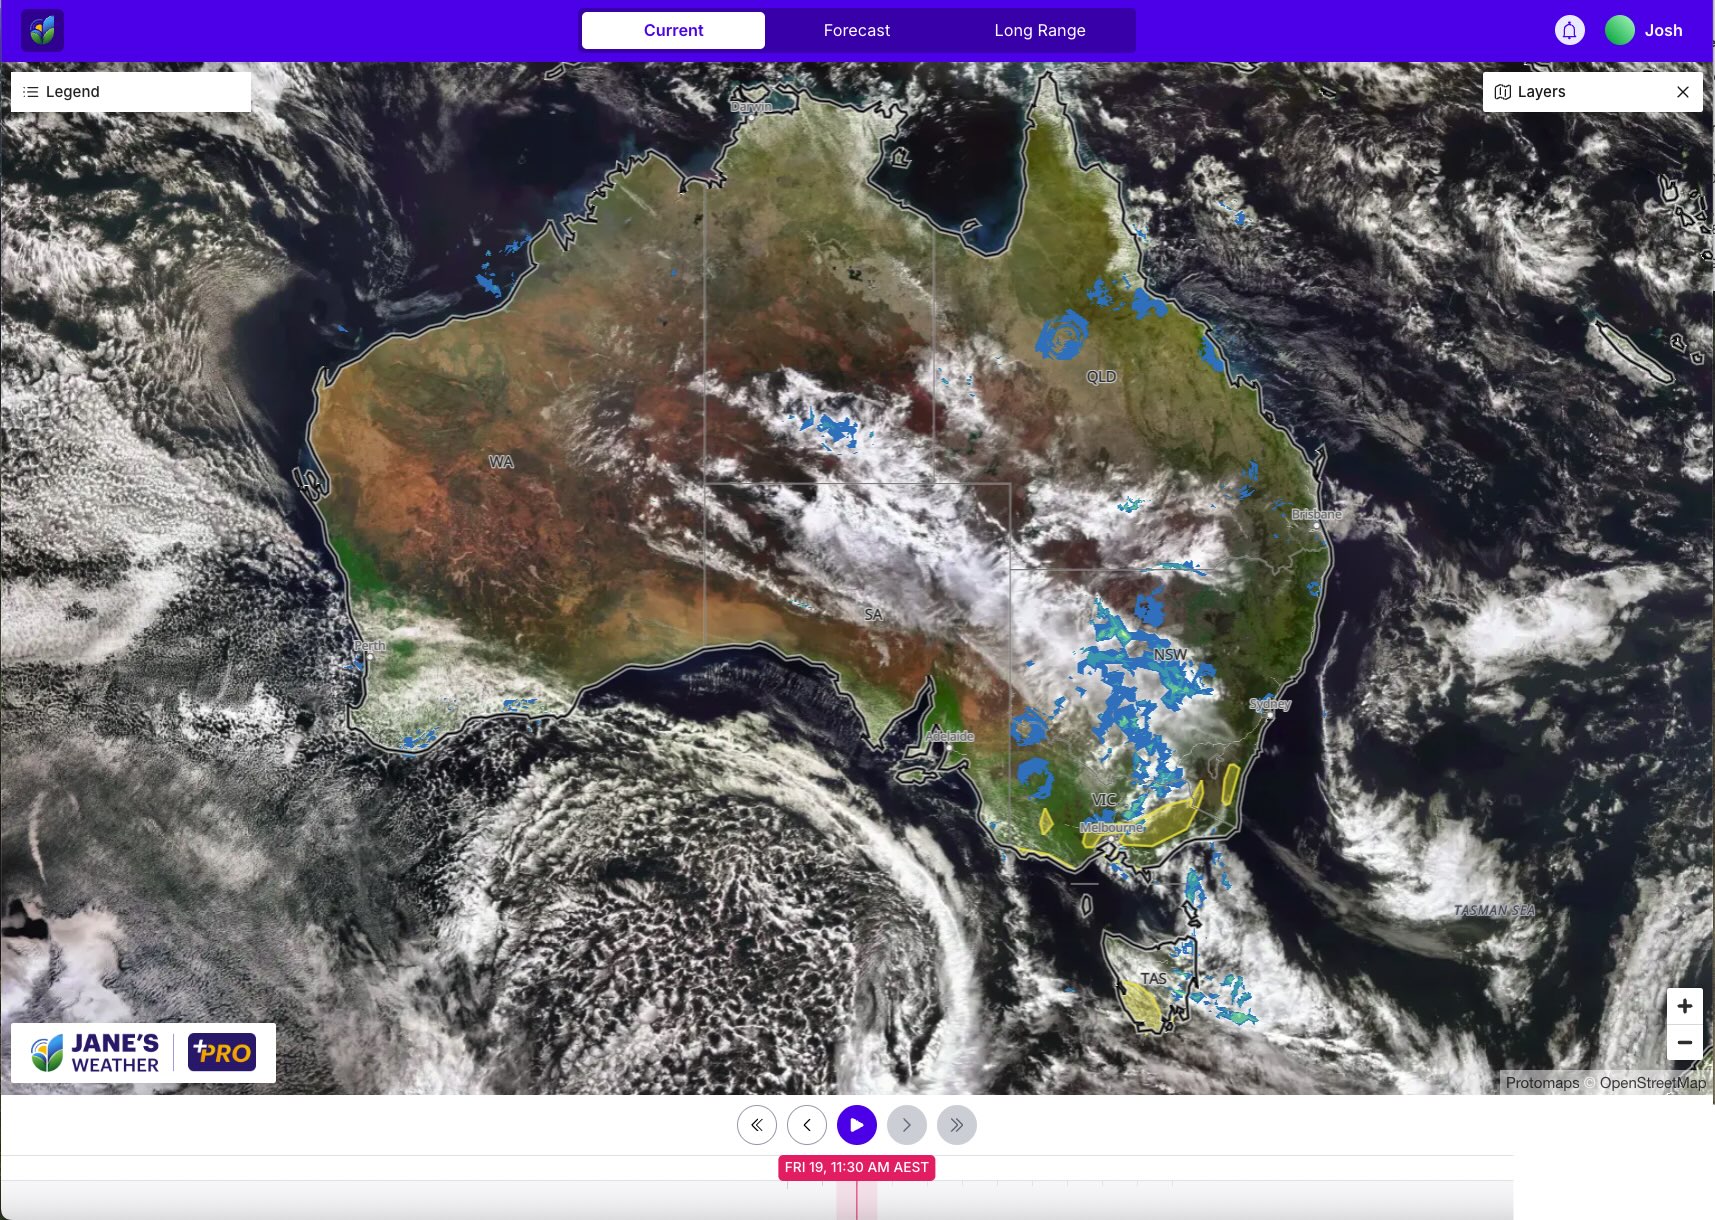
As these weather systems approach, warm and gusty northerly winds are strengthening in the tight pressure gradient that funnels the warm air across the southeast. Yellow areas are at risk of Damaging Wind Gusts - elevated areas from the gusty northerly ahead of the weather system, then add in the coastal areas as the front arrives.

The rainfall potential doesn't have huge totals on it this week, unless you are in western Tasmania, but it clearly shows the areas that will do best from the trough, and how the cold front kicks off a new series of them that should continue well into next week. They will keep coming until the next high pressure system moves in - which it may not have done by the end of next week. This means that forecasts from next Thursday onwards have low confidence at this stage, as the timing from the modelling currently has limited consensus from model to model. Wait for that before you make any decisions.
Meanwhile, the west is in for a stretch of warm and sunny conditions. When the high sits over the Bight, the west is on the warm side of the high. Perth and Melbourne could not be more different over the next week, in terms of both wet weather and temperature.
.jpeg)
Looking at the drivers of our weather patterns, and the new monthly guidance is in.
The Pacific Ocean has only one model crossing the threshold into La Nina. But the remainder are all on the negative side of Neutral, and we have a huge pool of warmer than average water off Queensland, so we are set for moisture no matter what the Pacific does as a whole.
.jpg)
The Indian Ocean has reached the peak of this Negative Indian Ocean Dipole (Negative IOD - the "La Nina' of the Indian Ocean). BoM will declare it next week, as they wait until we have been in it for eight weeks - they let you know after the event.
This means we will continue to be fed by moisture from the Indian Ocean - and wherever that runs into low pressure, then those are the areas that get the rain.
.jpg)
Sit back and have all this explained in movement and colour, as I walk you through the above and more in this week's video update. Perfect if you have 13 minutes to spare:
In this series I'll take you through the drivers of our weather, highlighting any changes over time and things to watch out for (generally every Sunday). It covers weather elements like temperature and rainfall, and how they are driven by moisture from the Pacific and Indian Oceans, as well as bursts of energy from low pressure (SAM and MJO).
See and hear my commentary as I take you through the weather pattern's effects on our rain and temperatures in detail over the next week, with a brief look at week 2 and beyond as well.
Plus what is driving our weather in the weeks and months ahead, with the latest on El Nino/La Nina, the Indian Ocean Dipole (IOD), the Southern Annular Mode (SAM controls our weather systems), and the Madden Julian Oscillation (MJO connects tropical moisture to our weather systems).
I update this commentary each week, generally on Sundays. Make sure you are signed up (free or a subscription) so you don't miss an update.
Stay up to date with the forecast specifically for your area in our hour by hour outlook for the next 10 days. Download our app for iPhone and Android.
As always, you can see each of these graphics as soon as they update, as well as more information about them under our Rain Outlook and Seasonal Outlook pages within Jane's Update, along with our Snow Forecast in the snow season.

For further insights specifically for agriculture, to improve the utilisation of your resources, tailored to any Australian location, please upgrade your membership. You can take advantage of our free 30 day trial.
Upgrade to see full insights to help plan the best use for your resources:
- frost risk
- spraying conditions
- evapotranspiration to efficiently manage available water for crops
- growing degree days to monitor growth
- full ten day hour by hour outlooks, all variables, and all model data
- customised alert notifications
.png)
.png)
.png)