.png)
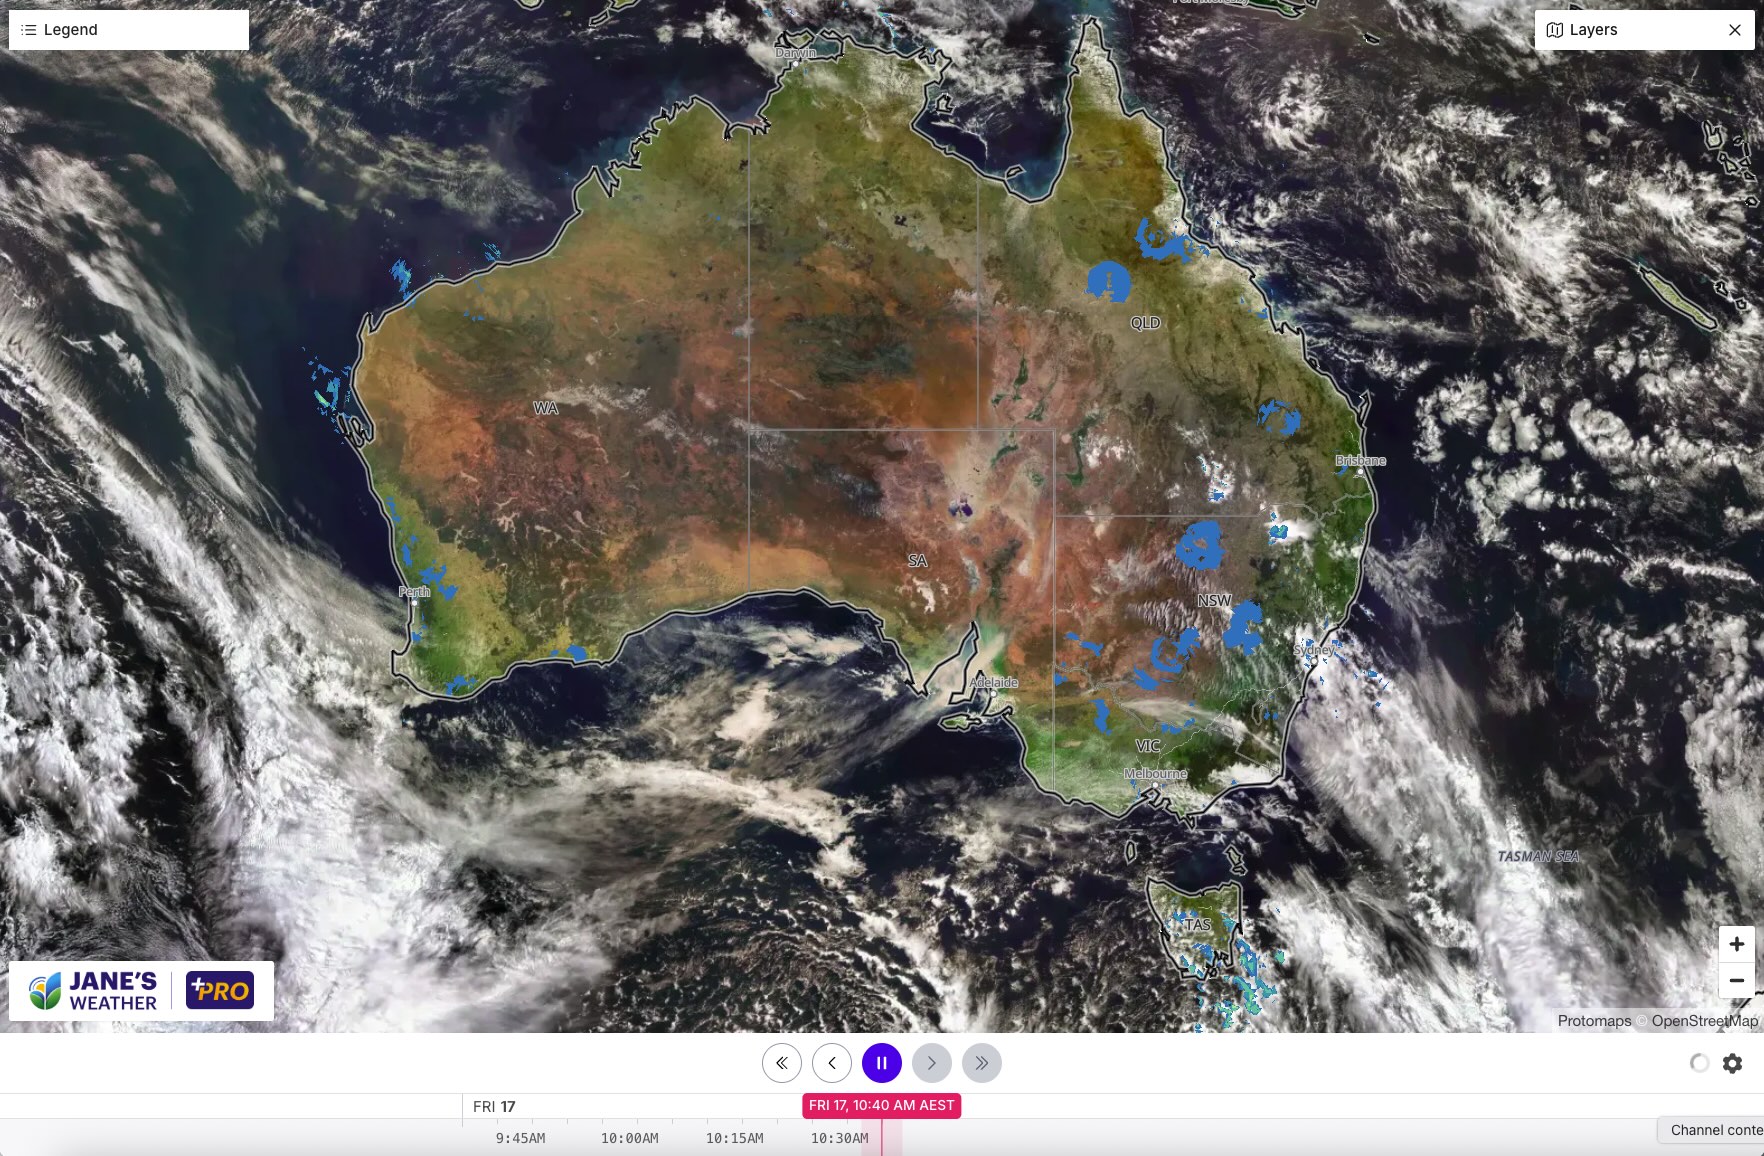
We're ending the week with a surge of heat, and a trough that produces showers and severe thunderstorms. That is only for QLD and NSW on Friday, it has cleared the southeast. This is followed by milder conditions (but still cold enough for snow in southern TAS - see how the speckled cloud only comes half way up the apple isle this time, not right into the mainland).
Meanwhile, we're starting to see cloud building over the Indian Ocean. This is the precursor to the next big weather system.
Up next is our next widespread rain system. The Negative Indian Ocean Dipole (see further down in this article) is doing its job to push moisture in from the Indian Ocean. Low pressure is meeting up with this to turn it into rain, and the pattern should spread that rain from the west through to the southeast.
This occurs from later in the weekend to mid next week (very slow moving), and I have here the latest guidance from this morning. Keep in mind that the path of the low pressure may change as it gets closer, so keep up to date with these rain maps. You can find the latest maps here: https://janesweather.com/rain-forecast.

.gif)
So, that is a big sweep of rain heading across the country, as shown in the week one summary/anomalies. There may be another surge to follow, but the guidance for week 2 (beginning Monday 27th October) has the rain signal confined to the tropics in the NT and QLD:
.gif)
The USA has declared a La Nina in the Pacific, but the Americans work on a lower threshold to the Australians - we need the signal to head further negative for BoM to call it:
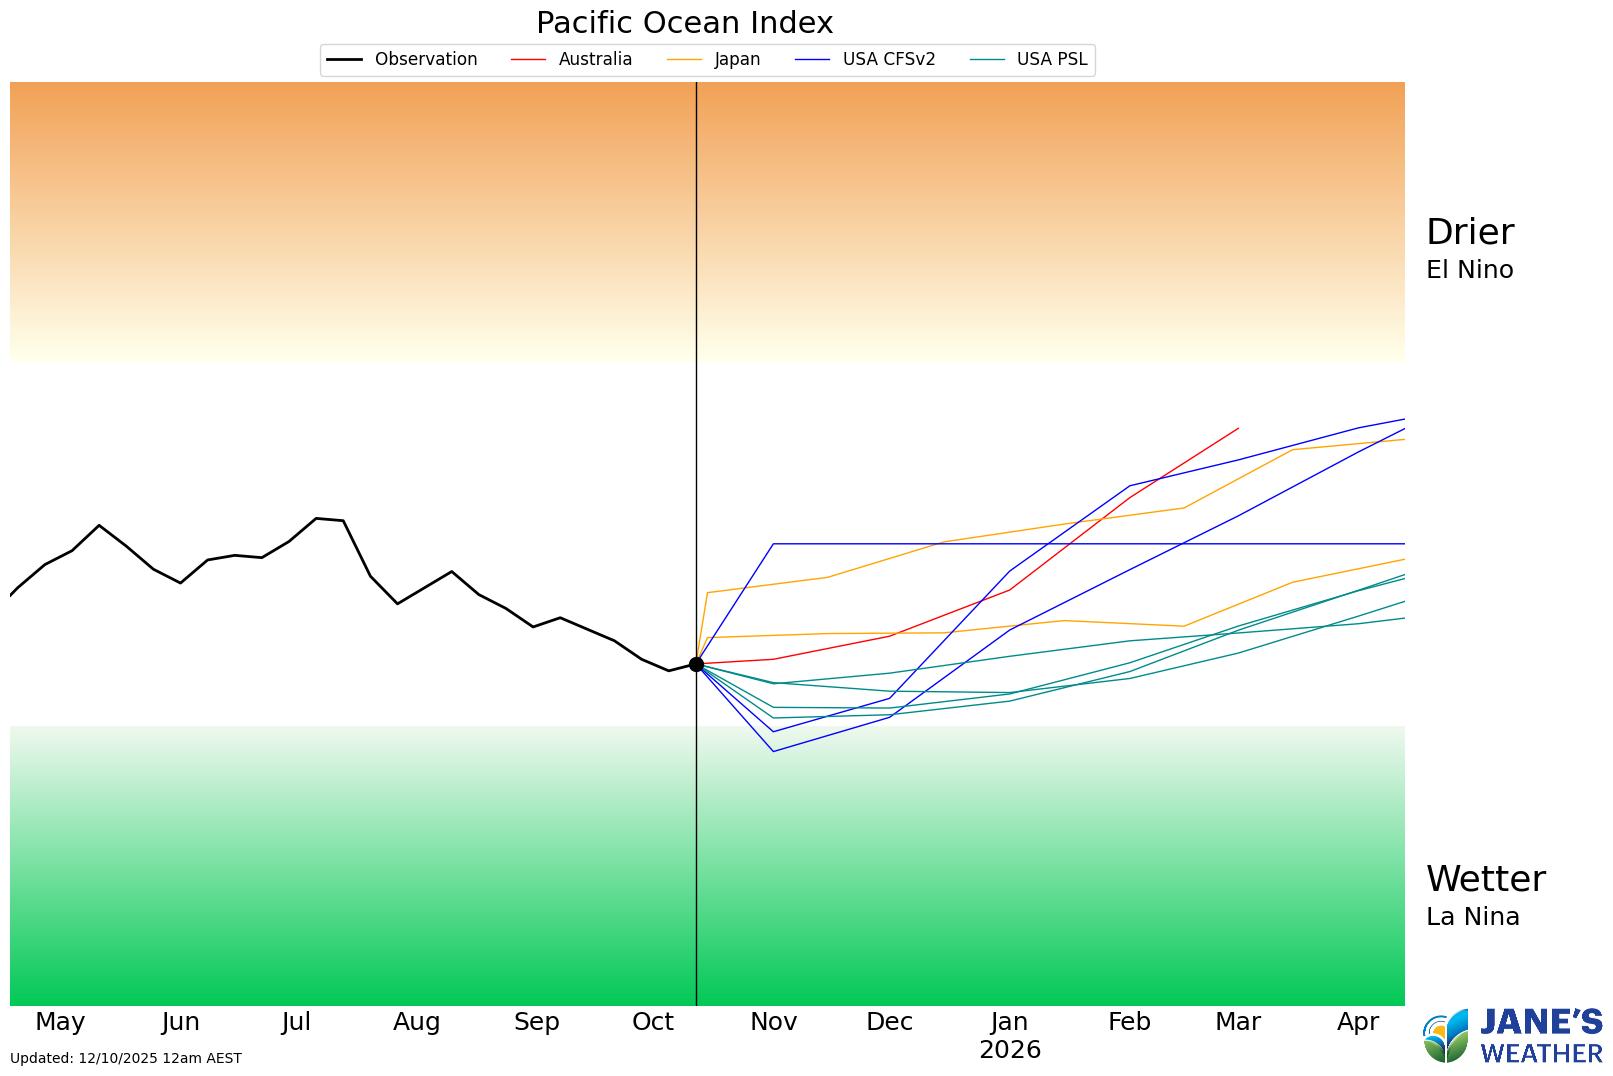
Meanwhile we've been across the negative Indian Ocean threshold since late July (in a Negative Indian Ocean Dipole [IOD], the 'La Nina' of the Indian Ocean - quite a strong one). The huge cloudband that we'll see with the next significant rain is a textbook example of this in action.
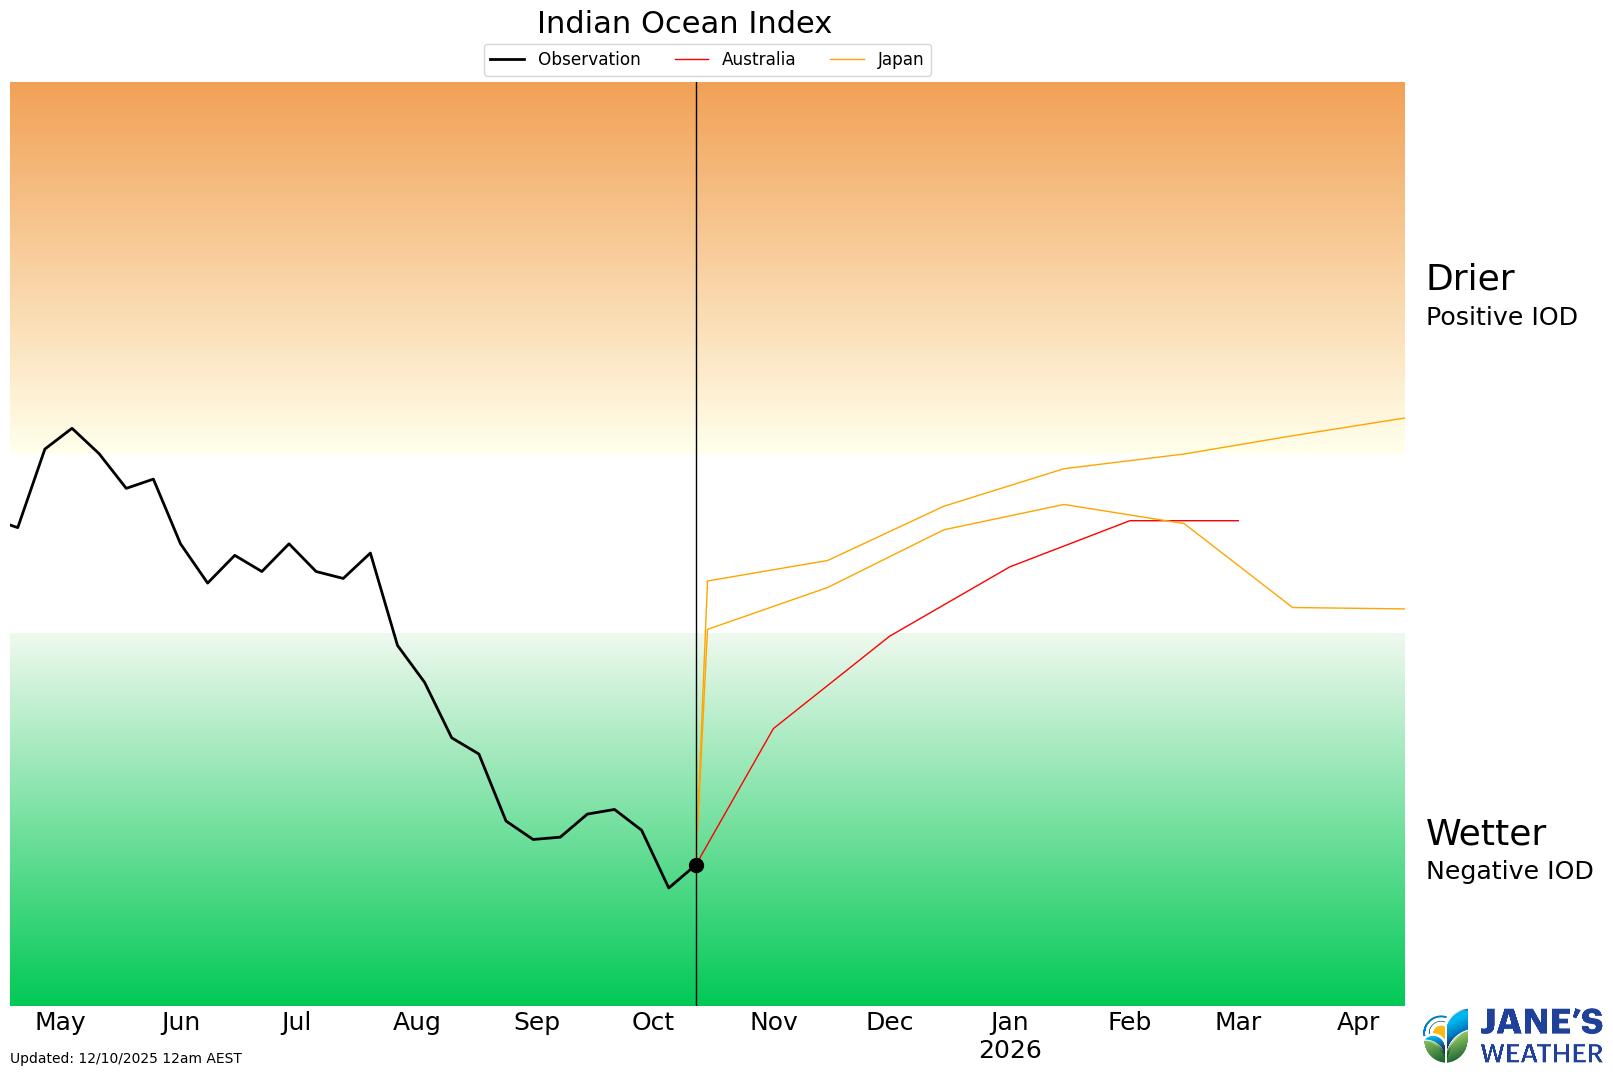
In simplest terms, what these two graphs tell us is that both the Indian and Pacific Ocean's are keen on sending excess moisture towards Australia. We also have warmer than average water around the majority of the country, further enhancing this.
So, the moisture part of the rainfall equation has a big tick.
Whenever that runs into low pressure it is turned into heavier than usual rain. But it is only for those that are in the path of the low pressure who get to see it.
As always I take you through all these charts and more in my weekly update video. If you have 14 minutes to spare, settle in as I discuss the latest:
In this series I'll take you through the drivers of our weather, highlighting any changes over time and things to watch out for (generally every Sunday). It covers weather elements like temperature and rainfall, and how they are driven by moisture from the Pacific and Indian Oceans, as well as bursts of energy from low pressure (SAM and MJO).
See and hear my commentary as I take you through the weather pattern's effects on our rain and temperatures in detail over the next week, with a brief look at week 2 and beyond as well.
Plus what is driving our weather in the weeks and months ahead, with the latest on El Nino/La Nina, the Indian Ocean Dipole (IOD), the Southern Annular Mode (SAM controls our weather systems), and the Madden Julian Oscillation (MJO connects tropical moisture to our weather systems).
I update this commentary each week, generally on Sundays. Make sure you are signed up (free or a subscription) so you don't miss an update.
Stay up to date with the forecast specifically for your area in our hour by hour outlook for the next 10 days. Download our app for iPhone and Android.
As always, you can see each of these graphics as soon as they update, as well as more information about them under our Rain Outlook and Seasonal Outlook pages within Jane's Update, along with our Snow Forecast in the snow season.

For further insights specifically for agriculture, to improve the utilisation of your resources, tailored to any Australian location, please upgrade your membership. You can take advantage of our free 30 day trial.
Upgrade to see full insights to help plan the best use for your resources:
- frost risk
- spraying conditions
- evapotranspiration to efficiently manage available water for crops
- growing degree days to monitor growth
- full ten day hour by hour outlooks, all variables, and all model data
- customised alert notifications
.png)
.png)
.png)