.png)
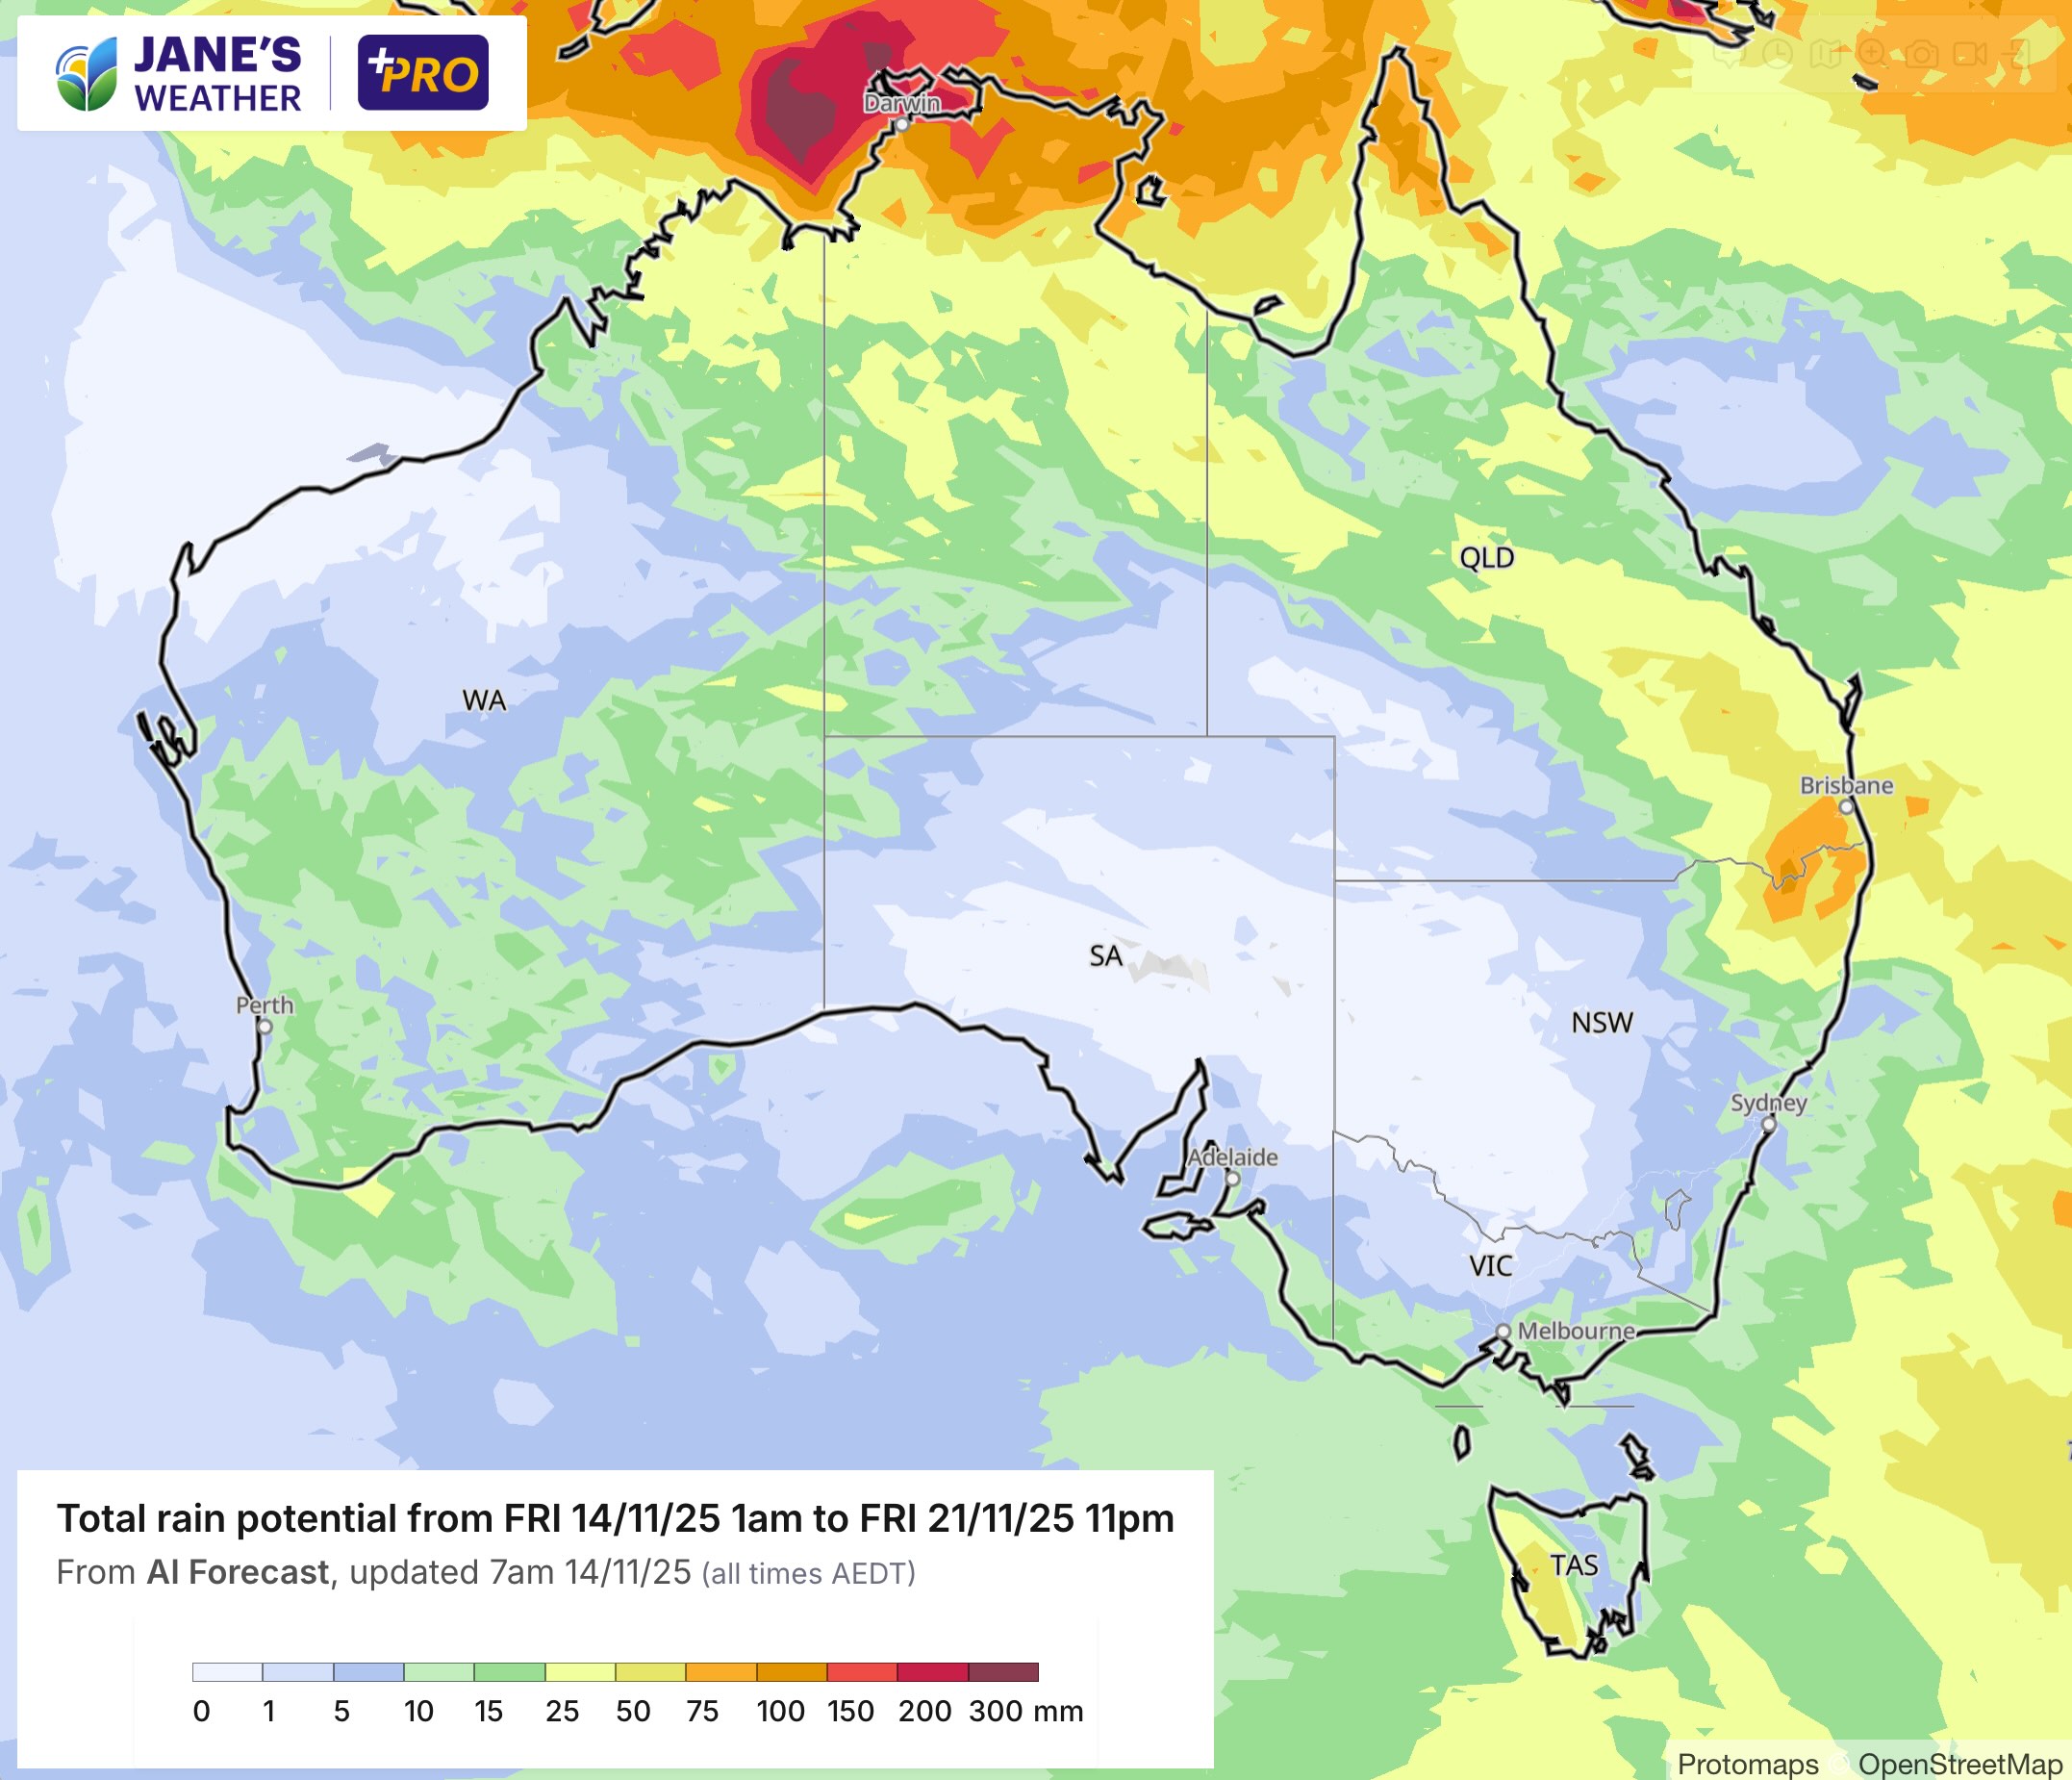
Across Friday and the weekend we have a significant weather system affecting the NT, Queensland and northeast NSW. Moisture is pouring in and low pressure is converting that into rain and thunderstorms. It will continue as long as the low pressure drives it and that doesn't contract northwards until early next week - that's when the next quiet and sunny stretch begins.
In the southeast there is an associated low pressure system, but it has lost its connection to moisture so its effects are much less significant. It wanders through on Friday into Saturday - and only if you are directly under a thunderstorm does it bring heavy rain. The next front arrives on Sunday, followed by another on Monday with yet another cold outbreak.
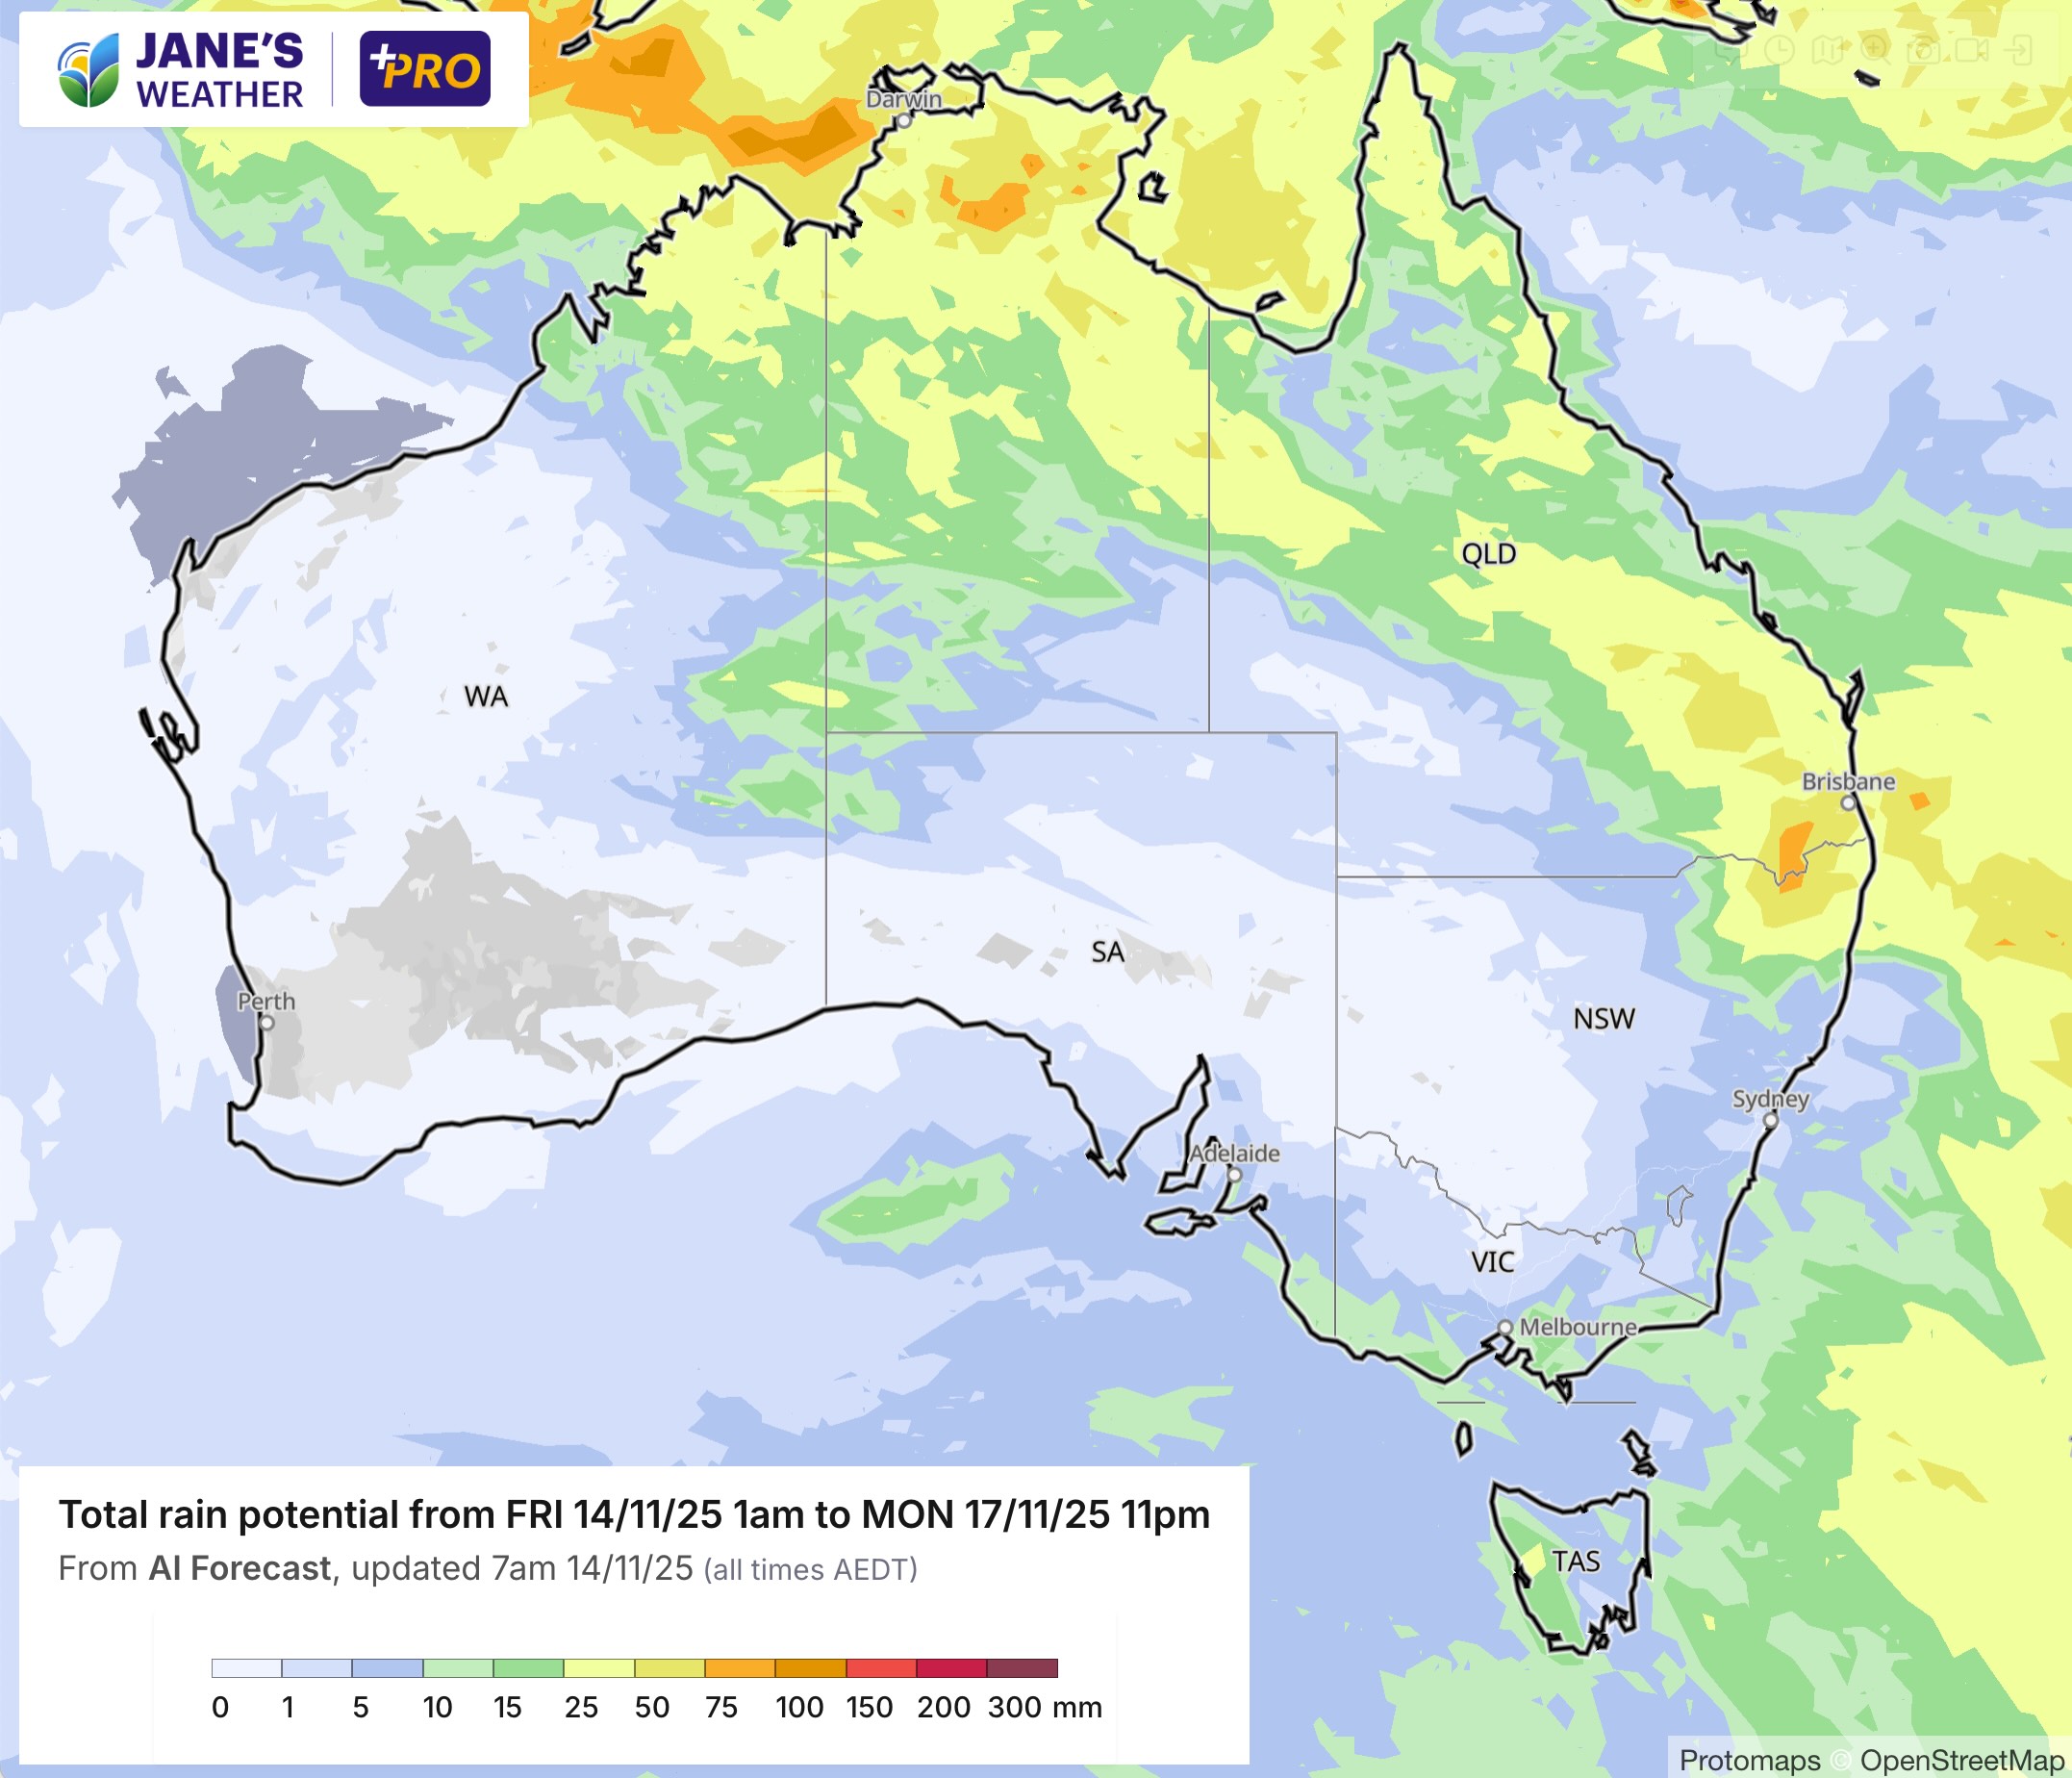
In the southwest it's mild for Friday and across much of the weekend. Then it warms up as the next heat trough snakes its way down the west coast. This brings hit and miss showers and thunderstorms from mid-next week (in the southwest - earlier further north).
Looking further ahead and the latest Sea Surface Temperature Anomaly (SSTA) shows a lot of warm water around Australia - particularly to our east. We care about this because warmer than average water provides more moisture to the air above it - and when that moisture gets pushed into low pressure (see the pattern described above for an example) then it produces more rain than it usually would - but only for those in the path of the low pressure.
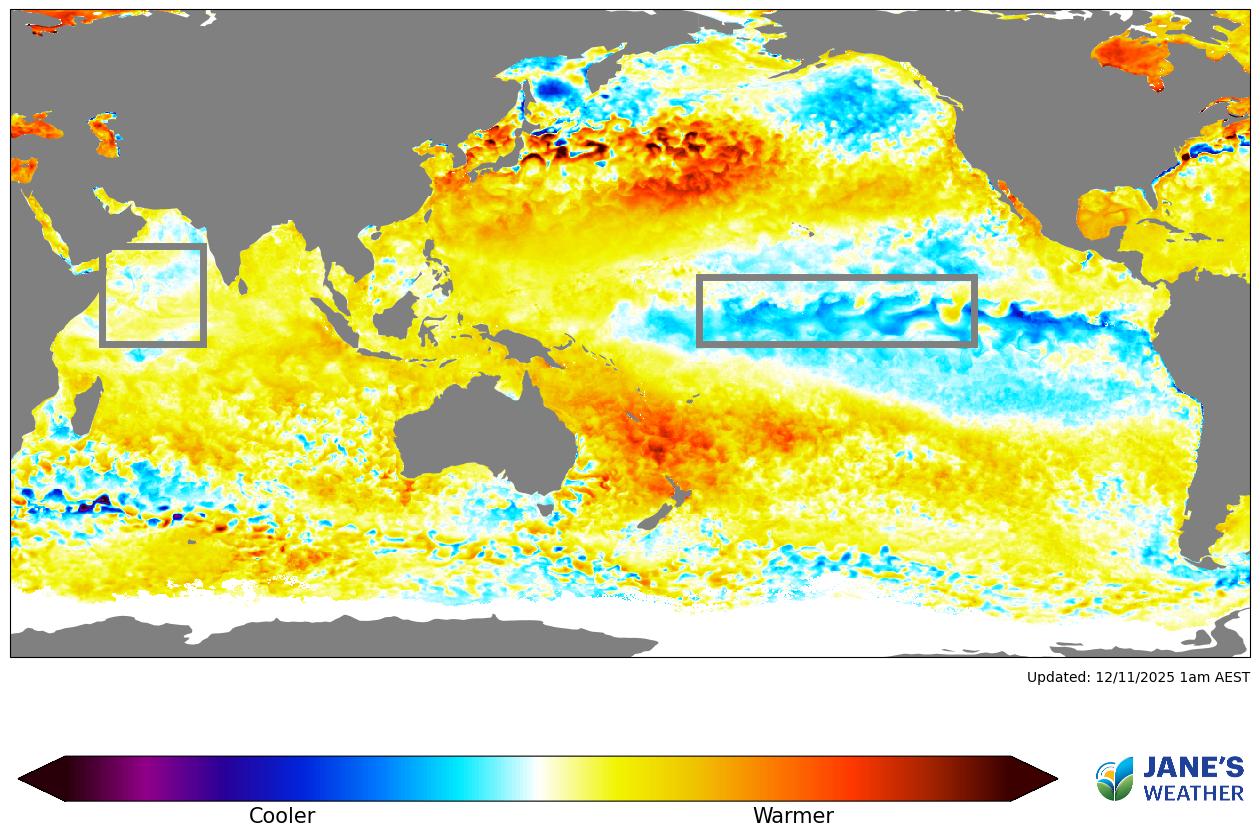
This extra moisture (or conversely lack of moisture) is described by whether we are in La Nina or El Nino - and we crossed the USA threshold for La Nina in October, but haven't quite made it to the Australian threshold.
Whether we cross the threshold or not, that SSTA map screams 'plenty of moisture from the Pacific Ocean' and whenever that runs into low pressure then those in its path will be soaked. It also provides more energy so there can be increased severity for any Cyclones or Thunderstorms.

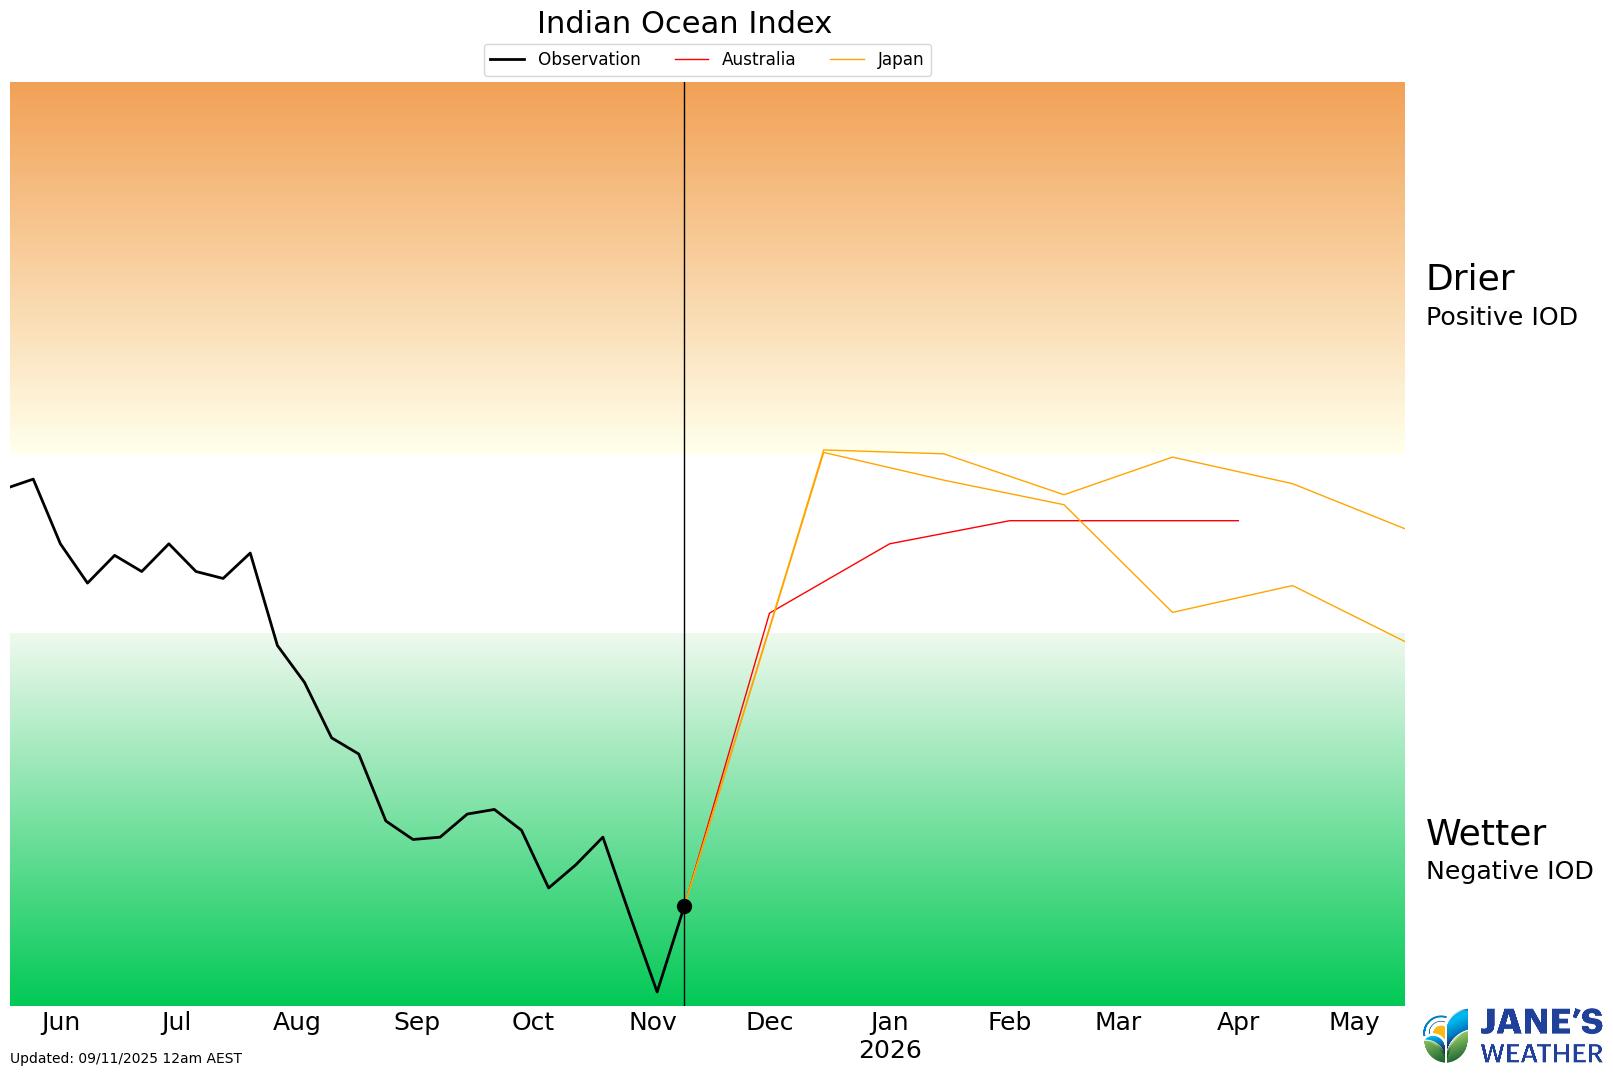
We've been in a Negative Indian Ocean Dipole (IOD) since late July, providing extra moisture from the Indian Ocean. Whenever that runs into low pressure it produces heavier than usual rain. We've seen this in action time and time again over the past few months - but only for those in the path of the low pressure.
The blue in the SSTA box over the Indian Ocean has significantly decreased over the past fortnight, modelling suggests we are coming out of the Negative IOD soon, and these phases naturally decay at the end of the year anyway - so this one may be nearly over.
Do note that there is plenty of warmer than average water off Australia's northwest coast though, so even if the phase is nearly done, our source of moisture may not be.
In this series I'll take you through the drivers of our weather, highlighting any changes over time and things to watch out for (generally every Sunday). It covers weather elements like temperature and rainfall, and how they are driven by moisture from the Pacific and Indian Oceans, as well as bursts of energy from low pressure (SAM and MJO).
See and hear my commentary as I take you through the weather pattern's effects on our rain and temperatures in detail over the next week, with a brief look at week 2 and beyond as well.
Plus what is driving our weather in the weeks and months ahead, with the latest on El Nino/La Nina, the Indian Ocean Dipole (IOD), the Southern Annular Mode (SAM controls our weather systems), and the Madden Julian Oscillation (MJO connects tropical moisture to our weather systems).
I update this commentary each week, generally on Sundays. Make sure you are signed up (free or a subscription) so you don't miss an update.
Stay up to date with the forecast specifically for your area in our hour by hour outlook for the next 10 days. Download our app for iPhone and Android.
As always, you can see each of these graphics as soon as they update, as well as more information about them under our Rain Outlook and Seasonal Outlook pages within Jane's Update, along with our Snow Forecast in the snow season.

For further insights specifically for agriculture, to improve the utilisation of your resources, tailored to any Australian location, please upgrade your membership. You can take advantage of our free 30 day trial.
Upgrade to see full insights to help plan the best use for your resources:
- frost risk
- spraying conditions
- evapotranspiration to efficiently manage available water for crops
- growing degree days to monitor growth
- full ten day hour by hour outlooks, all variables, and all model data
- customised alert notifications
.png)
.png)
.png)